
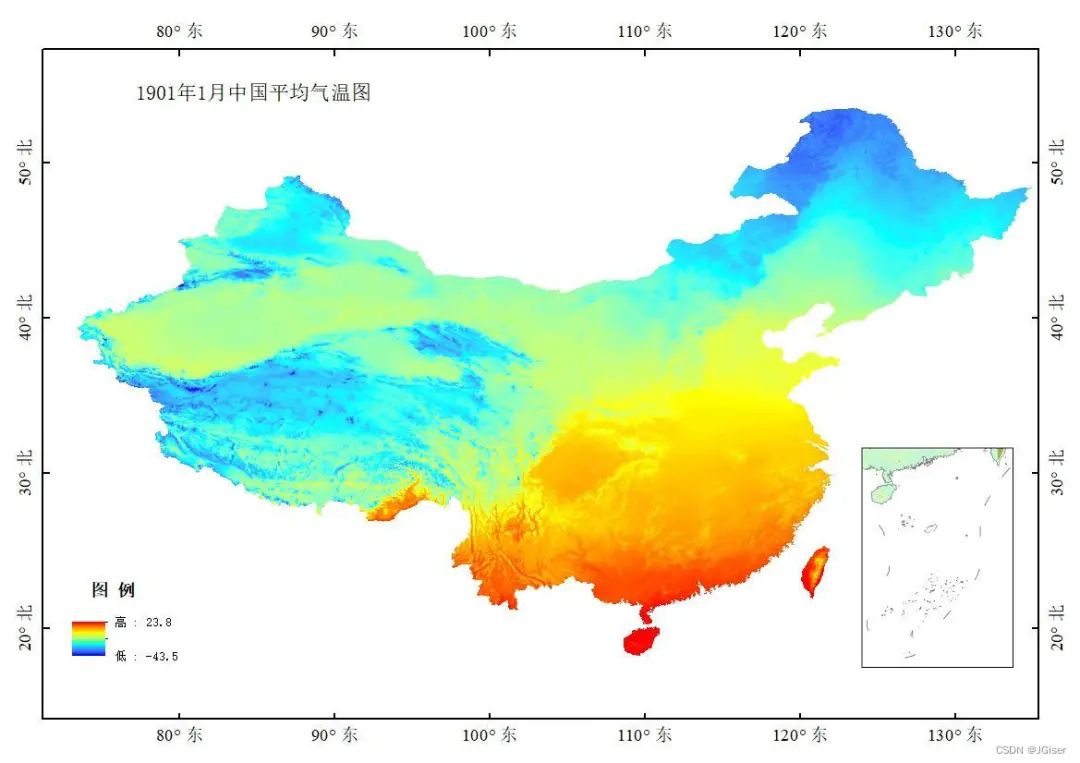
【数据简介】 中国逐月平均温度数据集覆盖全国主要陆地区域(包括港澳台),时间跨度从1901年1月至2023年12月,空间分辨率高达0.0083333°(约1公里)。数据以NETCDF(.nc格式)提供,单位为0.1℃。本数据集是基于CRU全球0.5°气候数据集和WorldClim全球高分辨率气候数据集,通过Delta空间降尺度方案在中国生成,并经过496个独立气象观测点的数据验证,确保结果的可靠性。
【数据文件命名方式和使用方法】
数据以“tmp_yyyy.nc”格式存储,其中“yyyy”代表年份,每个文件包含12个时间点,即1月至12月的数据。为节省空间,文件已压缩存储为“tmp_yyyy.rar”。使用ArcMAP软件或Matlab等工具可以轻松打开和处理这些.nc文件。在Matlab中,您可以使用ncread函数读取数据,例如:ncread('XXX.nc', 'var', [i j t], [leni lenj lent]),其中XXX.nc是文件名,var是变量名,i、j、t是起始行列时间,leni、lenj、lent是读取长度。
【坐标系统和导出建议】
建议使用WGS84坐标系统。在ArcMap中,您可以通过选择time维度来查看不同月份的数据,或者在图层属性中选择time维度的value列表来切换月份。进行栅格计算等操作前,建议将数据导出为栅格数据实体并存储在硬盘上,以便进行进一步分析。
- 数据引用
- 彭守璋. (2019). 中国1km分辨率逐月平均气温数据集(1901-2023). 国家青藏高原数据中心.
- https://doi.org/10.11888/Meteoro.tpdc.270961.https://cstr.cn/18406.11.Meteoro.tpdc.270961.
- 文章引用
- Peng, S. Z., Gang, C., Cao, Y., & Chen, Y. (2017). Assessment of climate change trends over the Loess Plateau in China from 1901 to 2100. International Journal of Climatology.
- Peng, S.Z., Ding, Y.X., Wen, Z.M., Chen, Y.M., Cao, Y., & Ren, J.Y. (2017). Spatiotemporal change and trend analysis of potential evapotranspiration over the Loess Plateau of China during 2011-2100. Agricultural and Forest Meteorology, 233, 183-194. https://doi.org/10.1016/j.agrformet.2016.11.129
- Ding, Y.X., & Peng, S.Z. (2020). Spatiotemporal trends and attribution of drought across China from 1901–2100. Sustainability, 12(2), 477.
- Peng, S.Z., Ding, Y.X., Liu, W.Z., & Li, Z. (2019). 1 km monthly temperature and precipitation dataset for China from 1901 to 2017. Earth System Science Data, 11, 1931–1946. https://doi.org/10.5194/essd-11-1931-2019
资源下载
下载价格9.9 元
VIP免费
立即购买